Manual / Stories & sharing
Stories & sharing
A story is an ordered set of scenes — saved views with a headline and narrative — played full-bleed in Present mode and shared as a read-only link your audience can actually explore.
Authoring scenes
- Save the view.
Frame the model and press Save scene on the bottom rail (Ctrl+B). The rail collects thumbnails; each tile can update to the current view or be removed (both with an Undo toast).
- Write the beat.
In the Story tab, give each scene a name, Headline and Narrative, set Duration (0 = fly straight through) and Transition, choose Motion (Static / Orbit / Push in) and optionally a Chapter (e.g. Resource · Metallurgy · ESG).
- Mix in other beat types.
The rail's + Add menu inserts a full-screen text Slide, a 360° scene (an on-site panorama with hotspots and a set landing view), a closing Call to action (booking link + lead capture), or Draft story… — an auto-drafted narrated story from the project.
- Narrate it (optional).
Each scene can carry narration — a hosted audio URL or a clip recorded in place, stored with the project.
- Add the descent.
The Descent panel captures named zoom levels (Regional → Project → Discovery) and plays the map fly-in that opens big.
- Reorder freely.
Drag scenes, use ▲/▼ or Alt+↑/↓, or open the slide-sorter overlay. Per-scene geo animation (build-up / peel / explode / chronology reveal) lives here too.
Present mode
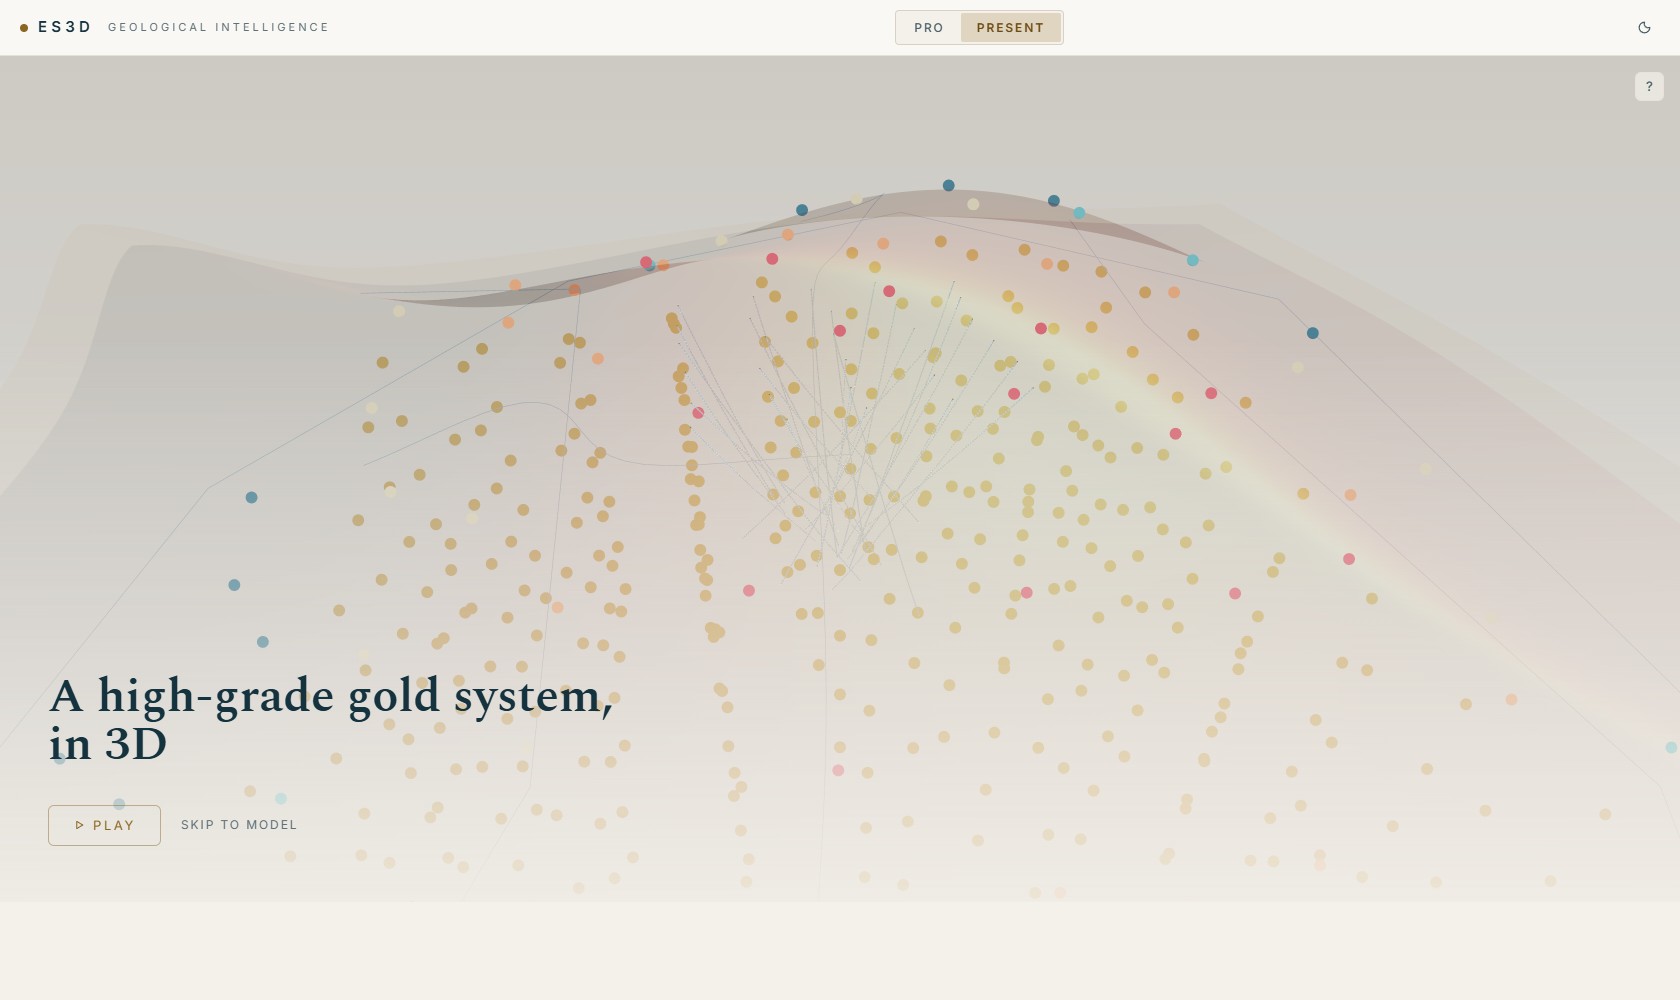
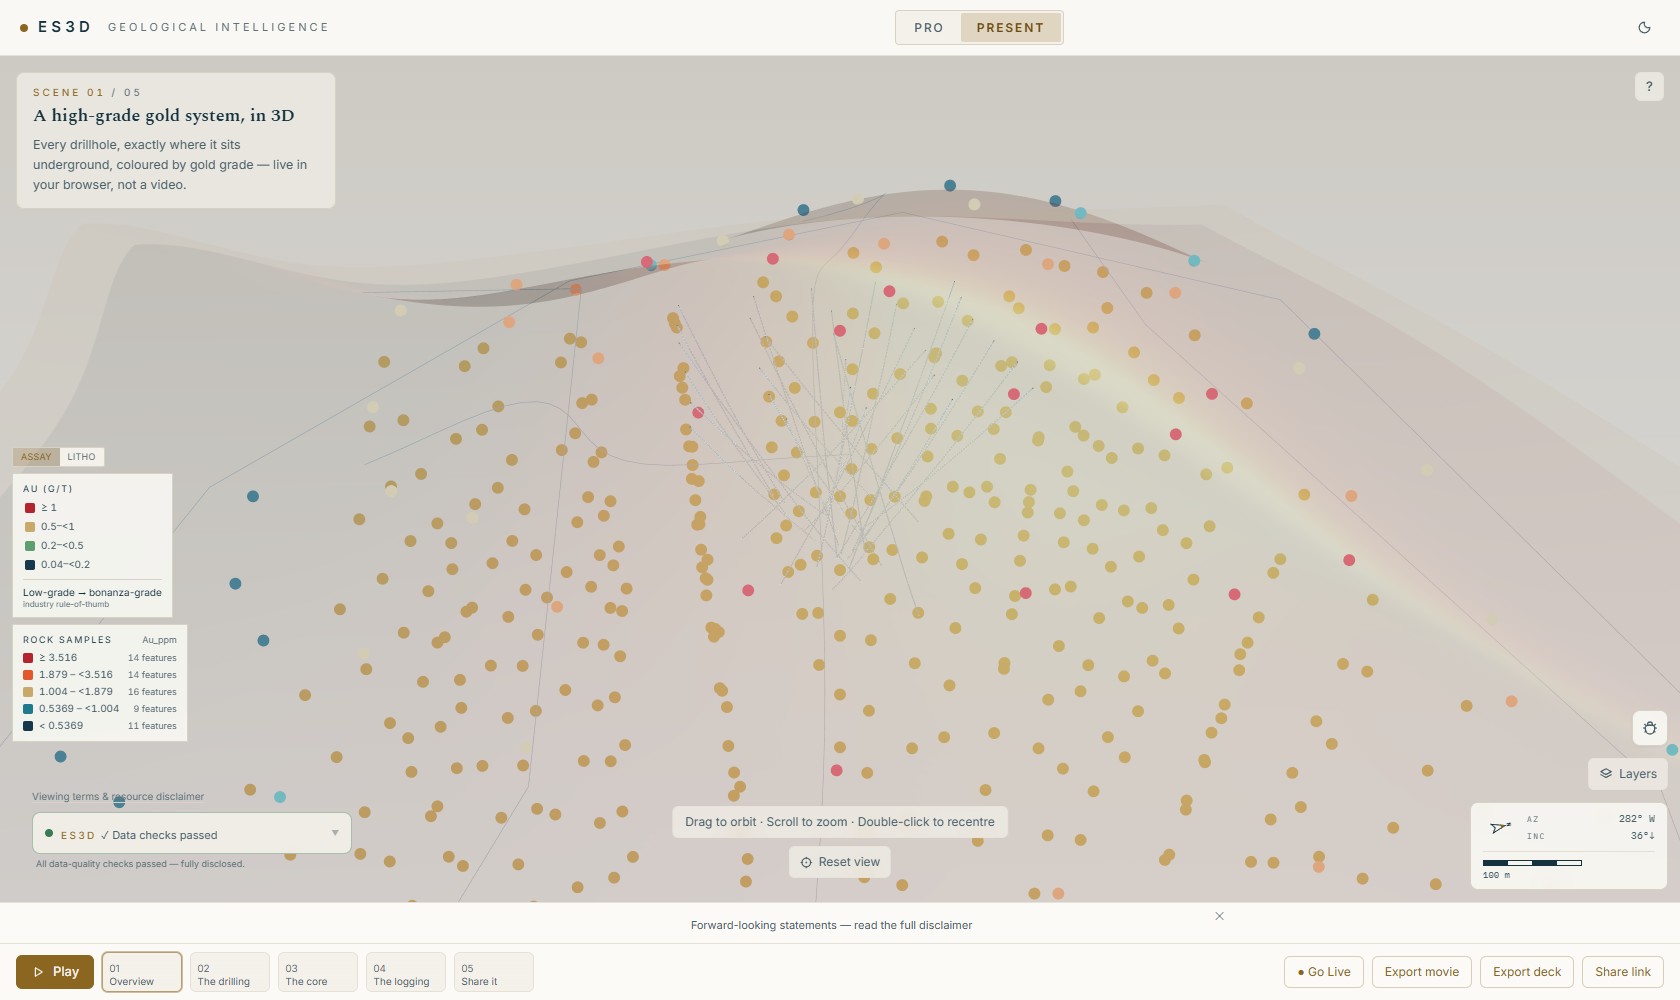
- The narrative card shows the scene number, headline and body with a dwell bar during auto-play — and it's pointer-transparent, so viewers orbit straight through it.
- The scene rail has Play/Stop and numbered thumbnails; chapters get a collapsible jump list top-right, each with a ⧉ deep-link copy.
- The tour yields to the viewer: orbiting or dragging the model, picking a rail thumbnail, jumping to a chapter or through a 360° hotspot, using ←/→ or Home/End, or pressing Return to this scene's framing all stop auto-play and leave the viewer exactly where they are — nothing snaps back and no scene is skipped. A click that doesn't actually move the camera isn't treated as an interruption. Play starts the story again from the first scene. A viewer following a ● Go Live presenter keeps mirroring the presenter's scene changes; only their own input stops their playback.
- Audiences stay oriented: if a viewer orbits away, a Return to this scene's framing chip appears; annotations and hotspots are visible but read-only; the ? chip teaches the gestures.
- Compliance is furniture, not fine print: the disclosure caveat, QP footer and forward-looking statement sit above the rail; the viewing-terms link, the Data checks passed badge and the NI 43-101/JORC summary card sit bottom-left — and if a figure is withheld, the reason is stated on screen. The all-clear Data checks passed chip is shown on scene 1 and steps aside once the story moves on to scene 2, so it does not ride over every beat; it returns if the story goes back to its cover. A chip that carries caveats stays for the whole story. The ✕ at the end of the strip clears the whole band for that session — caveat, QP footer, forward-looking statement and analytics notice go together, not one line at a time — and every row is back on the next reload. The viewing-terms and resource-disclaimer link sits outside the band by design, so it stays one click away even with the strip cleared; the ✕ itself is unavailable while an export is running.
Share links
Share (top bar) mints a read-only link — “Recipients can view & explore, but can't edit your project.” Options:
- Expires — never / 7 / 30 / 90 days.
- PIN — client-side encryption; the story opens only with the PIN.
- Company and Accent — the recipient sees your brand.
- Include project data — uploads the project bundle to your private cloud storage so the link carries the full model (with upload progress and a cancel); auto-skipped with an explanation when the project is too large. The bundle is compressed before it uploads, so a link is typically around a third the size it used to be and downloads that much faster for your audience — the trade is a few seconds of pause when the dialog first opens on a large project. Nothing is re-encoded and no detail is lost.
- Minimal chrome on phones — viewers on a phone or small tablet see this link without the on-canvas colour keys (grade ramp, lithology, classed points, issuer-highlight and targets keys) and without the all-clear data-quality chip, giving the model the corners they occupied. It is a per-link choice, off by default, and it trims chrome, never disclosure: a data-quality chip that carries caveats — clipping, over-range or below-detection notes, an undeclared coordinate system — still shows, and the compliance notices — viewing terms, resource disclosure, QP attribution — stay on every device. Desktop viewers of the same link see everything. Note that link options reset each time the Share dialog opens, so re-tick this before updating a published deck that uses it.
- Compliance checklist — legal review, forward-looking statement, news-release filing and trading-window checks, stamped into the link with a timestamp.
- Embed — width/height fields and a ready
<iframe>snippet for your website (chromeless, read-only) — and once you publish (below), the snippet points at your fixed address. The snippet ends with a small<script src="https://exploration.rocks/embed.js">line: keep it. It is what lets the embed’s full-screen button fill the screen on an iPhone, whose browser offers web pages no full-screen mode of its own — the button asks your page to let the model cover it, and tapping again puts the page back exactly as it was. Embeds pasted before 27 September 2026 lack that line; re-copy the snippet to add it (without it, an iPhone viewer gets an open-in-a-new-tab button instead).
Publish a fixed address
A share link carries the whole story inside the URL, so changing one beat gives you a different
link — and the <iframe> on your website has to be found and re-pasted.
Publish (in the Share dialog) fixes that: your story gets one fixed
address, exploration.rocks/e/your-project, and pressing
Update re-points it at whatever is on your screen. Nothing on the website
changes, ever. The address serves your story while your free trial or plan is active; if the
account is paused it shows a “paused” card instead, and your story returns the moment
you choose a plan (see Your free trial and plan).
- Choose the address once — it really is once. It is prefilled from your project name; lowercase letters, numbers and hyphens. After the first publish the field is fixed: Publish always re-points the address this project already has, and the dialog refuses to move the project to a different one. Unpublishing takes the page down but keeps the address reserved to you — it does not free the project to take a new address. Pick the one you are willing to leave on a customer’s website.
- Requires a cloud project. Sign in and save the project to the cloud first — a published address points at a saved project.
- No PIN. A published page has no way to ask for a PIN, so a PIN-protected link can’t be published. Clear the PIN to publish.
- One line tells you the truth. The dialog says whether the live page matches what is on your screen, so you always know if an Update is outstanding.
- The embed snippet follows. Once published, the Embed on a page snippet points at your fixed address instead of a one-off link.
- Unpublish takes the page down and keeps the address reserved to you, so nobody else can claim it and serve their own presentation into your customer’s page. It takes the page down, not the stored story: your narrative stays on our servers until you ask us to delete it. Write to us and we will — that also releases the address, which is why unpublishing doesn’t do it for you.
robots.txt and the major engines honour that,
which is tidiness rather than a lock. Two more things worth knowing: a published deck carries your
project’s internal ID inside it, and one published with project data also carries
your account’s internal ID in the download link — opaque IDs, not names or email
addresses, and no key to anything; and a story-only share link keeps its narrative in the URL and
never reaches a server, while publishing stores that text with us. See the
Privacy Policy.Seeing who watched
Every published deck counts its views — at its own address and in every embed of it, on your website or anyone else’s. The count is anonymous: it records that the tour was opened, which scenes were shown and for how long, whether a scene’s narration played to the end, and whether the viewer moved the section cut. It never records a name, an email address, an IP address or a device, and a viewer whose browser asks not to be tracked is not counted at all.
- Open the report.
In Present, press Share link. Under the published address, the Who watched box has View analytics — it opens the report in a new tab. The report is a web page at
exploration.rocks/r/…; bookmark it and it stays up to date. - Read it top to bottom.
Four numbers first: visits, total time watched, time per visit, scenes viewed. Then two or three plain sentences — which scene held attention longest, and how often the last scene was viewed. Then visits per day, and a table with one row per scene: how many times it was viewed (the bar compares it with the most-viewed scene), the average time on it, how often its narration was heard to the end, and how often a viewer moved the cut.
- Send it to your client.
Press Copy report link and paste it into an email. Anyone with that link can read the numbers — and only the numbers; it never opens your project. No sign-in is needed to read it.
- Take a link back.
Press Reset link, then confirm. A new report link is issued and every copy of the old one stops working at once. The counts themselves are kept.
On phones and tablets
A phone is for watching, not authoring. On a phone,
exploration.rocks opens as a viewer: the welcome screen offers the 30-second story,
and there is no Pro tab, no sign-in and none of the author’s
controls (exports, sharing, Go Live, layers). Build and share your story on a computer; open the
link on a phone to see what your investors will see.
Story mode keeps its chrome small. On every screen the scene card sits tight in the top-left corner and is only as large as its text, and the scene rail along the bottom is shorter, so more of the screen is the model. On a phone (and in a small embed or a landscape phone) the colour keys always keep their place: the Mineral Resource Estimate table folds to a single line you tap to open, and the estimate’s method disclosure above the scene rail shows its first two lines with a Read the full disclosure link — every word is one tap away.
A phone held sideways gives the model the screen. In landscape (and in any short embed) the app header steps aside, the compass card is withheld, the compliance strip collapses to a single line — the estimate disclosure, the forward-looking statement and the ✕ side by side, each still one tap from its full text — and the colour keys rest low, beside the viewing-terms link, instead of climbing under the scene card.
Wide establishing shots open at their authored scale on phones. A phone builds a deck’s map layers scene by scene, and the camera’s zoom-out limit used to be measured before the regional layers existed — so a country- or belt-scale opening beat was held zoomed in on a phone. The limit now uses each layer’s saved extent, so those beats frame as they were saved. Nothing needs re-publishing.
A portrait phone now sees your whole framing. A scene is authored on a landscape canvas; a portrait screen is a third of that width, and it used to keep the framing's height and crop the sides away — callouts and the edges of the deposit simply fell off screen. The camera now pulls back on narrow screens until the full authored width fits with a little breathing room around it, the way a landscape photograph letterboxes on a portrait phone — the frame floats inside the screen rather than pressing against its edges. Nothing is stored or re-authored: the same scene replays exactly as framed on any desktop, and a viewer can still pinch in on a phone for detail. Exports are never letterboxed — they render at their own landscape sizes.
The story yields the screen to the model on a phone. The scene card collapses to a single line — scene number and title — no wider than the title needs. Tap the strip to read the whole narrative (it scrolls if the beat runs long), tap again to put it away; moving to another scene puts it away for you. The scene rail swaps its thumbnails for numbered chips at phone widths, and the on-screen gesture hints describe touch (drag, pinch, double-tap) rather than a mouse. A full-screen button appears in the top-right corner on phones and tablets whose browser supports it — it hides the app header too, giving the model the entire display; press it again (or the device's back gesture) to return. iPhones are the exception: Safari there offers no full-screen control to web pages, so the button does not appear — but an iPhone viewing an embedded story gets an open-the-full-viewer link in the same corner instead, which opens the story in its own browser tab, free of the hosting page’s frame.
A shared story opens on a phone or a tablet, and the viewer adapts what it holds in memory to suit the device. The one visible difference is map imagery: satellite and drone orthos, geological maps and rasterised claim boundaries draped over the terrain are composited at a lower resolution on a handheld than on a desktop. At the framings a story actually uses — the whole property, a pit, a corridor of holes — that is at or beyond what the screen can resolve, so it looks the same. Pinch right in and the imagery is softer than the same view on a laptop, and a rasterised boundary line can read up to twice as wide.
Nothing else changes on screen. Elevations, drill traces, assays, imported solids and geological
solids are shown at full detail, the colours and legends are identical, and your imagery
is never rewritten — the smaller composite is built for the screen and never
written back, so every source pixel stays in the .es3d. Reopen the same story on a
desktop and the full-resolution imagery is there.
An export lifts the reduction. A deck slide, PNG still or movie is rendered from the largest imagery the exporting device can build, not from the smaller composite the screen was using. On a desktop that is the source resolution. A phone or tablet has a hard ceiling on how large an image its browser can allocate, so an export taken on a handheld may still be softer than the same export from a desktop — export a client-facing deck from a desktop. See Exporting.
One thing is stored: the still image saved with each scene, captured from what that device is showing. A scene saved or updated on a handheld may keep a softer still, and a deck slide uses that still whenever the beat cannot be re-rendered at export time. Updating the scene from a desktop replaces it.
On a phone, a deck loads as it plays. Phones have a fraction of a laptop's memory, so a story opened in an embed on a handheld builds the map layers each scene needs rather than every layer at once. Layers arrive as you move through the story, usually a scene ahead of where you are, so playing straight through shows nothing waiting. Jump several scenes at once and a layer can arrive a moment after the camera does; while one is still on its way you will see Loading map layers in the corner, and its row in the 3D layers list is marked Loading. Nothing is left out — a layer you turn on yourself is built on the spot, and saving a project always writes every layer whatever is on screen at the time. On a laptop, on a desktop, and in the authoring workspace every layer is built up front exactly as before.
Filled map polygons no longer count against a phone. The solid fill of a polygon layer — a country silhouette, a claims block, a tenement package — is rebuilt from the layer's own outlines when a scene first shows it, so a saved project or a share link no longer carries those triangles at all unless the layer is visible the moment the project opens. On map-heavy decks this is most of the weight: fills the size check used to count are often half the story. The saving applies from the next save or share. A link minted earlier keeps the size it was minted with, so if a story is refused on handhelds, open the project, mint a fresh share link and — for a published deck — publish again to the same address; the deck itself does not change. Mint from the project as it opens: recalling a map-heavy scene first turns those layers on, and what is on screen when you mint is what travels. If a story is still refused after that, the remaining route is a lighter deck: fewer or coarser surfaces and geometry layers.
Go Live
● Go Live drives the story to every connected viewer in real time — they follow your scene changes and playback, see a Following presenter notice, and can leave at any time. You get a LIVE pill with relay state and a follow link to send. The share dialog says it plainly: anyone with a live link can also steer which scene connected viewers see.
/e/ address and every embed
of it are counted the same way — see Seeing who watched.