Manual / Colour, legends & filters
Colour, legends & filters
Every layer is styled from the Layers tab's scene tree, every colour decision flows through one display-scale authority, and the legend on screen is always exactly what the canvas draws. (One share option can withhold the legend itself on phones — see Minimal chrome on phones; the rule here is that a legend, when shown, never disagrees with the canvas.)
The scene tree
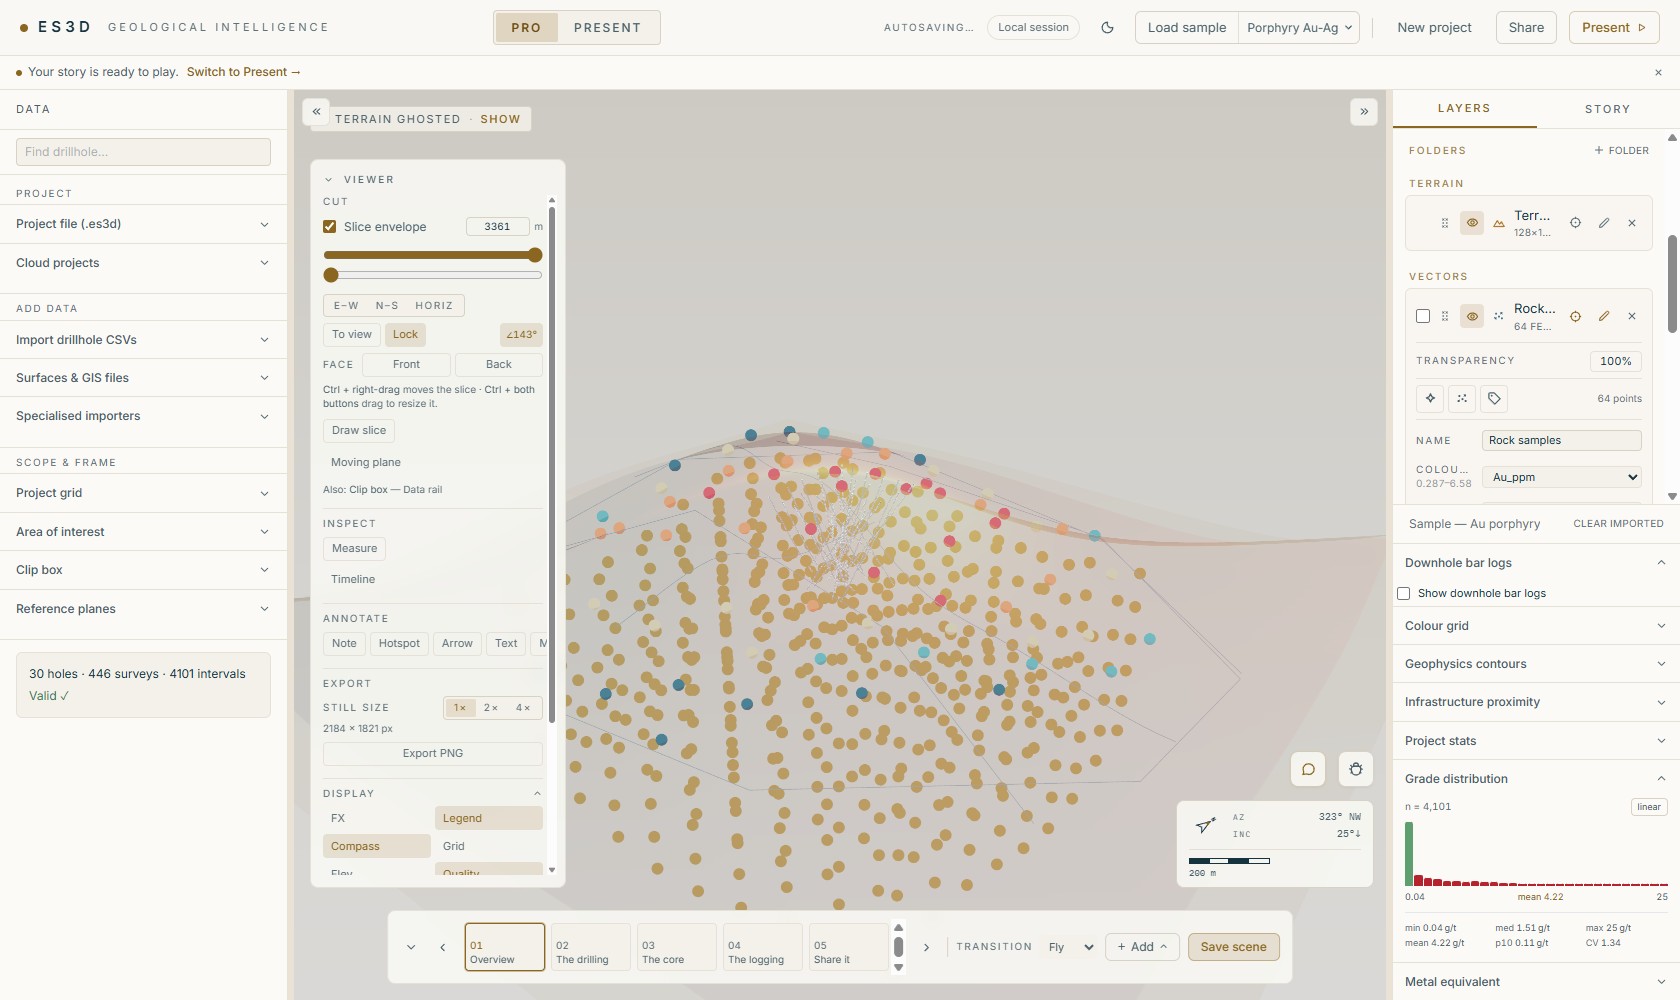
Layers group by kind — Drillholes, Drillhole databases, Terrain, Vectors, Block models, Surfaces & models — plus your own folders. Each row: a drag grip (or focus + arrow keys) to reorder, the eye toggle, a type glyph, the name (double-click to rename), Zoom to this layer, the pencil Edit layer, a download button where an honest export exists, and Remove.
- Find anything — the Filter imported layers box flattens the tree to matches, including layers inside collapsed folders.
- Bulk edits — Ctrl/Shift-click or the checkboxes select several rows; a sticky bar offers Group, Move to…, Hide/Show, Zoom and Remove.
- Folders — collapse, folder-wide visibility, and a folder-wide group style (colour + transparency cascade; a child's own colour always wins).
- Honest counts — a block-model row states “showing N of M blocks ≥ cutoff”; nothing is silently truncated.
- Bin opacity (block models) — with a block model coloured Binned, each bin row has an opacity box beside its colour, from 0 to 100 %. Turn the low-grade shell down to 15 % and the high-grade core reads through it. Opacity belongs to the block layer, so drillholes coloured by the same element are unaffected. It saves with the project.
Layer styling
The pencil panel always leads with Transparency, then the controls the layer kind supports: Colour by attribute (numeric or category), colormaps, flat colour, point size / line width / fill opacity, outlines, 3D sphere markers, elevation nudge, Drape on terrain with its own opacity, Conform to terrain, raster stretch with percentile clips, hillshade sun controls, contour interval / explicit levels / labelling, X-ray, display cutoffs and a confidence wash.
A polygon fill you have switched off isn't stored in the project file. Filled claim blocks and mapped units are by far the heaviest thing a polygon layer carries — on a real deck, one claims layer's hidden fill was a ninth of the whole file — so a project saves the outlines and the source boundaries, and rebuilds the fill from those the moment you turn Fill polygons back on. There is a short pause the first time on a big layer, and then it behaves exactly as before: same shape, same colour, same query filtering. Because it is rebuilt rather than replayed, it settles onto whatever terrain is loaded at that moment — which is what you want if you have since loaded a better DEM, and worth knowing if you have removed the one it was drawn against. A fill that is on when you save is stored as it is, and so is one on a layer whose source boundaries weren't kept.
Effects give a layer presence without lying about data: Outline, Shadow, Glow and polygon fills, each with intensity, opacity, size, softness and direction controls. Labels come per layer: Label by attribute, size, halo, a max-label budget and an attribute filter for which features get labelled.
Classification
Classify… turns a continuous ramp into legend classes. The five methods say what they're for, in the app's own words:
| Method | When to use it |
|---|---|
| Natural breaks (Jenks) | “Cuts where the data already clusters — background vs anomalous populations.” |
| Equal count (quantile) | “Equal number of samples per class — good for ranking, hides real gaps.” |
| Equal interval | “Equal-width classes — simple, but skewed data collapses into one colour.” |
| Log (geometric) | “Equal multiplicative steps — the honest default for log-normal geochem.” |
| Manual cutoffs | “Your own cutoffs — statutory or assay thresholds (e.g. 100 / 500 / 1000 ppb).” |
Pick 2–12 classes; skewed data gets a gentle nudge toward Log. No-data always renders in a dedicated slate — never gold, never a class colour. Clear returns to the continuous ramp.
Grade legends
Assay colouring is a per-element display scale — theme, colormap, bins, ramp min/max — shared by the drill intervals, the block model and the on-canvas legend, so a colour means one thing everywhere. Numeric drill attributes default to binned scales with sensible grade bins; edit them once and every surface follows.
Query filters
Both the drillholes group and any attribute-bearing vector layer take a named query filter (the same editor everywhere): conditions on any column, Match all / any, per-condition negation — plus intercept conditions for drilling (see Drill data). Filters save with the project, apply per scene, and always show their matched count. What a filter hides, every legend, label and export respects.
Filtering a vector layer from Ask
The Ask assistant can set and clear these filters for you. Name the layer and the cut — “filter Soil geochem to Cu over 400”, then “clear the filter on Soil geochem”. Use the layer's name as it reads in the scene tree: Ask is handed the roster of filterable vector layers, their attribute columns and any filter already on them as part of the project overview, so it aims at a real layer instead of guessing at one. A name that matches nothing, matches two layers, or names a layer that cannot carry a filter (a raster, a mesh) is refused and you are asked which you meant — it never picks for you. Mention no layer and the filter goes to the drillholes, as it always has.
Conditions on a vector layer are numeric only — the six comparisons
(=, !=, >, <, >=,
<=) against a number, each negatable, combined with
Match all / any. Drillhole filters go further: they also take category
columns (lithology codes, hole IDs) and intercept criteria. A vector layer takes neither, and a
column the layer doesn't carry rejects the whole request rather than applying the rest of it
— a filter naming a column that isn't there would report itself applied and change nothing
on screen.
A filtered layer's legend key states what it is withholding. The card reads “Filter ‘name’ — N of M features shown”, counting features rather than the vertices that draw them, and it says the same thing on screen, and on the deck slide. The one exception is a line or polygon layer restored from an older project file, where the counts cannot be narrowed to the filter at all: the card says exactly that, rather than presenting full tallies as filtered ones. Keys count only what the map actually draws, so a layer switched off — or one sitting inside a folder you've hidden — is no longer keyed at all.